Learn to trade with Japanese Candlesticks - Continuation Patterns
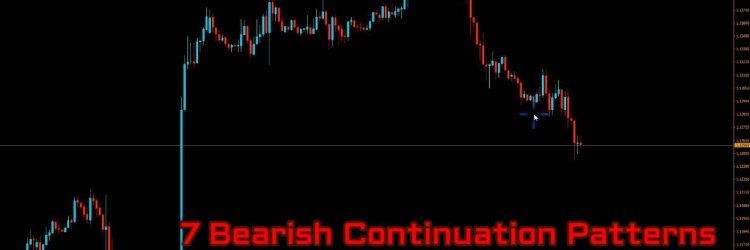
Previously we looked at Japanese Candlesticks reversal patterns as well as introduction to Japanese Candlesticks in general. Now let's take a look at some continuation patterns, as even those can be used to make money.
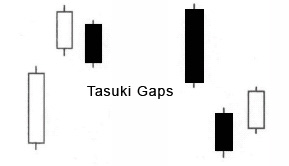
Upside & Downside Tasuki Gap
You can see that if you spot a gap between two candlesticks with the same color (in the direction of the trend). The third candlestick then opens WITHIN the second body and closes WITHIN the gap.
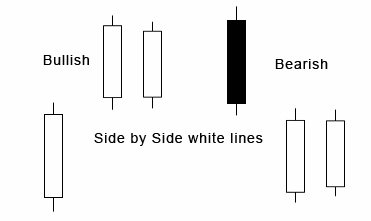
Side by side white lines
Bullish continuation pattern consists of 3 white candlesticks, see the image below. Bearish is the same shape BUT the first candlestick is filled while the second and third candlesticks are still empty. The gap is in the direction of the trend.
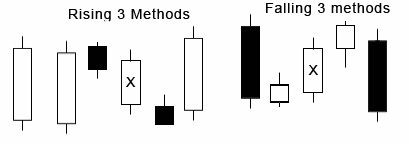
Rising Three Methods and Falling Three Methods
Pattern consisting of 5 candlesticks. The color of the THIRD body does not matter. The first candlestick represents the existing trend.
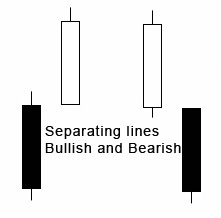
Separating lines
Two candlesticks with opposite colors, the first candlestick being the opposite to the current trend.
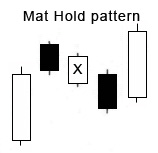
Mat Hold
Bullish Continuation pattern. It is similar to the Rising Three Methods - 3 middle small bodies going in the opposite direction of the trend. However, here the second body doesn't have to be within the first body and the third body only touches the first body just a bit.
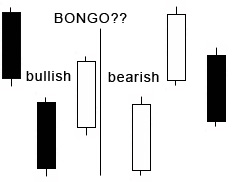
Upside Gap Three Methods and Downside Gap Three Methods
Consisting of 3 candlesticks, first two with the colour and direction of the current trend but with a gap between, and the third one opens within the second candlestick's body and closes within the first candlestick's body filling the gap
On Neck
Bearish continuation pattern.

In Neck
Pretty much the same as On Neck, see if you can spot the small difference.

Thrusting
Bearsish continuation pattern.

Upside & Downside Tasuki Gap
You can see that if you spot a gap between two candlesticks with the same color (in the direction of the trend). The third candlestick then opens WITHIN the second body and closes WITHIN the gap.

Side by side white lines
Bullish continuation pattern consists of 3 white candlesticks, see the image below. Bearish is the same shape BUT the first candlestick is filled while the second and third candlesticks are still empty. The gap is in the direction of the trend.

Rising Three Methods and Falling Three Methods
Pattern consisting of 5 candlesticks. The color of the THIRD body does not matter. The first candlestick represents the existing trend.

Separating lines
Two candlesticks with opposite colors, the first candlestick being the opposite to the current trend.

Mat Hold
Bullish Continuation pattern. It is similar to the Rising Three Methods - 3 middle small bodies going in the opposite direction of the trend. However, here the second body doesn't have to be within the first body and the third body only touches the first body just a bit.

Upside Gap Three Methods and Downside Gap Three Methods
Consisting of 3 candlesticks, first two with the colour and direction of the current trend but with a gap between, and the third one opens within the second candlestick's body and closes within the first candlestick's body filling the gap

On Neck
Bearish continuation pattern.

In Neck
Pretty much the same as On Neck, see if you can spot the small difference.

Thrusting
Bearsish continuation pattern.

more in learn
Learn to trade with Japanese candlesticks - trend reversal patterns
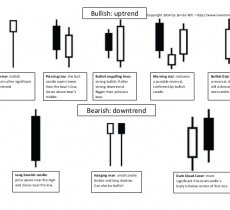
Previously we looked into how different candlesticks might look. Now, as we all know, or should know, the best time to buy cryptocurrency is just after a trend reversal. But how to spot potential trend reversal indications on a candlestick chart?

Previously we looked into how different candlesticks might look. Now, as we all know, or should know, the best time to buy cryptocurrency is just after a trend reversal. But how to spot potential trend reversal indications on a candlestick chart?
Trading cryptocurrencies - introduction to Japanese candlesticks
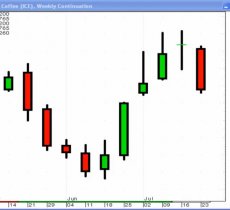
A candlestick chart looks a bit different from a normal chart with just a line with opening or closing prices on it. And compared to a usual high-low chart Japanese Candlesticks chart can make it easier to see certain patterns in the market and see data relationships.

A candlestick chart looks a bit different from a normal chart with just a line with opening or closing prices on it. And compared to a usual high-low chart Japanese Candlesticks chart can make it easier to see certain patterns in the market and see data relationships.
Good Indicators for trading crypto currencies
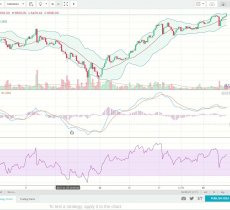
Assuming you've installed Metatrader and signed up a demo account with some trading company that supports Metatrader, which indicators should you start testing? And how to use those indicators for trading cryptocurrencies? Or should you be using any indicators at all?

Assuming you've installed Metatrader and signed up a demo account with some trading company that supports Metatrader, which indicators should you start testing? And how to use those indicators for trading cryptocurrencies? Or should you be using any indicators at all?
Let's talk about automated trading bots and compounding
There are different kinds of automated crypto trading bots out there. In this post I'll mainly talk not about the bots which simply trade your crypto based on certain trading signals, but bots that are mainly hyip.

There are different kinds of automated crypto trading bots out there. In this post I'll mainly talk not about the bots which simply trade your crypto based on certain trading signals, but bots that are mainly hyip.
Learn to trade cryptocurrencies
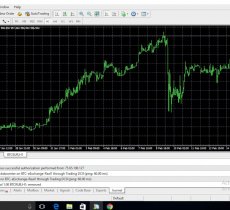
How can you trade cryptocurrencies with Metatrader? What indicators should you use when trading cryptocurrencies? And much more. Lets start trading crypto for real!

How can you trade cryptocurrencies with Metatrader? What indicators should you use when trading cryptocurrencies? And much more. Lets start trading crypto for real!
|
|
